The market value of Tata Sons’ listed investments is estimated at Rs 16 trillion
Tata Sons, the investment-holding arm of Tata group companies, could fetch valuation of Rs 7-8 trillion in an initial public offering (IPO), based on the current market capitalisation of group firms, according to a report.
The market value of Tata Sons’ listed investments is estimated at Rs 16 trillion. The group could derive another Rs 1-1.5 trillion of value from unlisted investments and step-down subsidiaries such as Tata Technologies, Tata Metalliks and Rallis, according to a report by investment banking firm Spark PWM.
Investors are likely to give a holding company a 30-60% discount when calculating the equity value, and Tata Sons’ value would be Rs 7.8 trillion, factoring a 60% discount, it said.
Four group companies – Tata Motors, Tata Chemicals, Tata Power and Indian Hotels Company (IHCL) – hold ownership in Tata Sons. The only realistic way for potential value unlocking of Tata Sons stake is through Tata Chemicals wherein the ownership is about 80% of the company’s market capitalisation. The stake is worth about 16-21% of the mcap for the other three companies, it said.
According to Reserve Bank of India regulations, it is mandatory for an upper-layer NBFC to list within three years of the notification. On September 14, 2023, the RBI had notified 15 companies, including Tata Sons, under this category. The holding company would now have to list on the bourses by September 2025.
“There are multiple levers of value available from unlisted investments as the group is entering into new-age segments such as semi-conductors (Tata Electronics),” it said. The IPO could likely lead to the simplification of the group holding structure.
“We believe that about 80% of Tata Sons’ holdings might not be monetisable, but the process of restructuring could trigger a re-rating,” it added.
A majority stake in Tata Sons is held by philanthropic trusts of the group, with Sir Dorabji Tata Trust and the Sir Ratan Tata Trust being the biggest among them. Sir Dorabji Tata Trust holds a 28% stake, Sir Ratan Tata Trust a 28% stake and other promoter trusts hold a 14% stake as of March 2023.
Sterling Investment Corporation and Cyrus Investments hold 9% stake each. The group also has several cross-holdings, with Tata Motors and Tata Chemicals holding 3% each, Tata Power Company 2% and IHCL 1% stake.
An earlier report by Kotak Securities said Tata group was considering selling a 5% stake in Tata Sons through the IPO to raise about Rs 55,000 crore at an estimated valuation of Rs 11 trillion.
HNIs use multiple-account route to bypass RBI’s Rs 1-crore limit on IPO funding by NBFCs
High net-worth individuals (HNIs) have been routinely circumventing the Rs 1-crore limit set by the Reserve Bank of India for funding of initial public offerings (IPOs) by NBFCs, market sources told Moneycontrol. They have been doing that by opening multiple accounts with the non-banking finance companies (NBFCs), of which they are the ultimate beneficiary.
To curb the frenzy in the IPO market fuelled by money borrowed from NBFCs, the RBI imposed a ceiling of Rs 1 crore on the amount that NBFCs can lend a borrower for an issue, effective April 1, 2022.
It may have helped, to an extent, temper the previously massive subscriptions in the bigger sized IPOs but has done little to dampen the craze for IPOs of small and micro (SME) enterprises.
Moneycontrol spoke to some of the HNIs who invest in IPOs using borrowed funds and this is how the “system” operates:
HNIs open multiple accounts with the NBFC in the name of family members, their firms, family offices, trusts and even employees.
IPO funding requires the client to put up a certain amount as margin. This may vary between 1 and 10 percent; depending on how many times the NBFC expects the issue to be oversubscribed. Lower the subscription, higher is the margin collected from the clients. Conversely, the margin collected is lower if the issue is expected to see heavy subscription.
Reason being, higher the number of times the issue is subscribed, lesser the number of shares that will be allotted to applicants. So a lower upfront margin will be enough to cover any potential downside if the IPO flops on listing.
Say the client has put up a margin of Rs 50,000 and is allotted shares worth Rs 2 lakh, the NBFC is covered even if the stock falls 20 percent on listing.
JG Chemicals IPO last bidding day today: Check GMP, subscription status, review, key dates, more. Should you subscribe?
JG Chemicals IPO opened for subscription on Tuesday, March 5, and today (Thursday, March 7) is the last day to apply to the issue for those who are interested in subscribing. In the two days that the issue has been available for subscription, both retail and non-institutional investors have responded enthusiastically. JG Chemicals IPO subscription status was 6.40 times, as per BSE data, on the second day. The retail investors portion was subscribed to 8.32 times, Non Institutional Investors (NII) portion was booked 9.64 times, and Qualified Institutional Buyers (QIB) portion was booked at 45%. On day 1, JG Chemicals IPO subscription status was 2.47 times.
It has reserved not more than 50% of the shares in the public issue for qualified institutional buyers (QIB), not less than 15% for non-institutional Institutional Investors (NII), and not less than 35% of the offer is reserved for retail investors.
JG Chemicals IPO price band has been set in the range of ₹210 to ₹221 per equity share of the face value of ₹10. Investors can bid for a minimum of 67 equity shares and in multiples of 67 equity shares thereafter. JG Chemicals raised ₹75.35 crore from anchor investors on Monday, March 4.
The Opposition bloc INDIA virtually sounded the bugle for the upcoming Lok Sabha polls on Sunday when top leaders, including Congress’s Rahul Gandhi who took a break from his cross-country tour, converged in Patna for a mammoth rally.
Rahul, who is currently on a Bharat Jodo Nyay Yatra, flew from Madhya Pradesh to Bihar to share the stage with the RJD’s Lalu Prasad and Tejashwi Yadav, Samajwadi Party’s Akhilesh Yadav, the CPI-M’s Sitaram Yechury and the CPI’s D Raja, besides Congress president Mallikarjun Kharge.
The absentees
Notable absentees were the chief ministers of Delhi, West Bengal and Tamil Nadu Arvind Kejriwal, Mamata Banerjee and MK Stalin, respectively, as well as Shiv Sena (UBT) chief Uddhav Thackeray and NCP founder Sharad Pawar.
This comes as the INDIA constituents struggle to seal a formal seat-sharing deal in Bengal and Maharashtra, and are yet to announce one for Tamil Nadu.
The Congress has sealed seat-sharing deals with AAP in Delhi, Gujarat, Goa and Haryana but will be a rival in Punjab. It has finalised a seat-sharing arrangement in Uttar Pradesh with the SP.
In Bihar…
Sunday’s mega rally came as part of Tejashwi Yadav’s Jan Vishwas Yatra that he launched after JDU chief Nitish Kumar jumped the INDIA ship to go back to the NDA fold. A Congress-RJD-Left seat-sharing deal is yet to be announced.
In Patna, Rahul charged the Modi government with “working for only two-three super-rich people and neglecting Dalits and backward classes who comprise 73% of the population”.
Kharge, Tejashwi and Lalu targeted Nitish for switching sides ahead of the Lok Sabha polls.
Yechury and Raja denounced the Modi government’s policies, alleging these were only benefiting big businesses, and praised Tejashwi’s emphasis on job creation.
Akhilesh Yadav posted a picture of himself seated with Tejashwi and Gandhi on X, captioning it: “Great thrones are shaken when enthusiastic youngsters come together (jab joshile naujawan mil jaate hain, bade bade takht hil jaate hain)
Prime Minister Narendra Modi chaired a brainstorming session on the vision document for ‘Viksit Bharat 2047’ with the Union Council of Ministers on Sunday.
This is expected to be the last formal meeting of the Union Council of Ministers before the upcoming Lok Sabha elections.
According to government sources, the ministers discussed detailed action plans for the next five years.
A 100-day agenda for immediate steps was also worked upon for quick implementation after formation of the new government in May.
Eye on future
The roadmap for Viksit Bharat – which means a developed India — is a result of more than two years of intensive preparation.
It involved a ‘whole of government’ approach that included all ministries and wide-ranging consultations with state governments, academia, industry bodies, civil society, scientific organisations and mobilisation of youth for seeking their ideas, suggestions and inputs.
More than 2,700 meetings, workshops and seminars were held at various levels. Suggestions of more than 20 lakh youth were received.
The roadmap for Viksit Bharat has a comprehensive blueprint that clearly articulates national vision, aspirations, goals and action points.
Election clock ticks
Meanwhile, the Election Commission of India (EC) is likely to announce the Lok Sabha poll schedule in a couple of weeks.
The EC has begun reviewing the preparedness of various states for holding the elections.
In 2014, the EC had announced the schedule for the nine-phase Lok Sabha elections on March 5 and the results were declared on May 16.
In 2019, the poll panel had announced the seven-phase Lok Sabha elections on March 10 and the results were declared on May 23.
ગુજરાત કોંગ્રેસમાં એક સાંધે ત્યાં તેર તૂટે જેવા હાલ અંબરીશ ડેર બાદ હવે અર્જુન મોઢવાડિયાનું પણ રાજીનામું
Gujarat Politics : લોકસભા ચૂંટણીને ગણતરીના મહિના બાકી છે ત્યારે કોંગ્રેસના અનેક દિગ્ગજ નેતાઓ રાજીનામા આપી રહ્યા છે. કોંગ્રેસના પૂર્વ ધારાસભ્ય અંબરીશ ડેર બાદ હવે કોંગ્રેસના ધારાસભ્ય અને પૂર્વ પ્રદેશ પ્રમુખ અર્જુન મોઢવાડિયાએ પણ રાજીનામું ધરી દેતા રાજકારણમાં હડકંપ મચ્યો છે. તેમણે ગુજરાત વિધાનસભા પહોંચીને સ્પીકર શંકર ચૌધરીને રાજીનામું સુપરત કર્યું હતું. આ રાજીનામા પછી વિધાનસભામાં કોંગ્રેસનું સંખ્યાબળ 14 થઈ ગયું છે. કોંગ્રેસમાંથી મોઢવાડિયાએ ધારાસભ્યપદેથી રાજીનામું આપતા હવે પોરબંદરની પેટા ચૂંટણી પણ આવશે.
મેં દબાણમાં નહીં પણ સ્વેચ્છાએ રાજીનામું આપ્યું છે : મોઢવાડિયા
અર્જુન મોઢવાડિયાએ એક્સ પરથી કોંગ્રેસનું પ્રતીક હટાવી દીધું છે. રાજીનામું આપ્યા બાદ અર્જુન મોઢવાડિયાની પ્રથમ પ્રતિક્રિયા સામે આવી છે. મોઢવાડિયાએ કહ્યું છે કે, ‘મેં કોઈના દબાણમાં નહીં પણ સ્વેચ્છાએ રાજીનામું આપ્યું છે. ઘણાં સમયથી હું કોંગ્રેસમાં ગુંગળાઈ રહ્યો હતો. રામ મંદિર વિવાદનો ઉકેલ બંધારણીય રીતે આવ્યો હોવા છતાં કોંગ્રેસે પ્રાણ પ્રતિષ્ઠા કાર્યક્રમનો બહિષ્કાર કર્યો હતો, જે અયોગ્ય હતું. હવે મારે નહીં કોંગ્રેસે આત્મમંથન કરવાની જરૂર છે.’
સૂત્રોના જણાવ્યાનુસાર, વર્ષ 2022માં કોંગ્રેસના ઉમેદવાર તરીકે ચૂંટણી જીતેલા મોઢવાડિયા પેટા ચૂંટણીમાં ભાજપના ઉમેદવાર બની શકે છે. ધારાસભ્ય બન્યા પછી તેમને ભાજપમાં મહત્ત્વની જવાબદારી મળે એવી પણ ચર્ચા છે. ગુજરાત કોંગ્રેસમાં એક સાંધો તો તેર તૂટે જેવી સ્થિતિ છે.
અર્જુન મોઢવાડિયાનું રાજીનામું આપવાના કારણો!
એવું કહેવાય છે કે, અર્જુન મોઢવાડિયા કે.સી. વેણુગોપાલે ગુજરાત બાબતે લીધેલા નિર્ણયો અંગે નારાજ હતા. એટલું જ નહીં, વિપક્ષના નેતાની પસંદગી વખતે પણ કોંગ્રેસ હાઈ કમાન્ડે તેમને વિશ્વાસમાં લીધા ન હતા. કદાચ આ કારણસર જ તેઓ વિધાનસભા ચૂંટણી પછી પક્ષમાં સક્રિય ન હતા. આ ઉપરાંત રામ મંદિરના મુદ્દે કોંગ્રેસ હાઈ કમાન્ડે લીધેલા નિર્ણયો સામે પણ તેઓ નારાજ હતા. ભરતસિંહ સોલંકી બાદ અમિત ચાવડાની પ્રદેશ પ્રમુખ તરીકે નિમણૂક કરવાના નિર્ણય સાથે પણ તેઓ સંમત ન હતા.
છેલ્લા કેટલાક મહિનાઓથી રાજીનામાની થઈ રહી હતી ચર્ચા
તમને જણાવી દઈએ કે, છેલ્લાં કેટલાક સમયથી પોરબંદરના કોંગ્રેસના ધારાસભ્ય અર્જુન મોઢવાડિયા કોંગ્રેસ છોડીને ભાજપમાં જોડાઈ શકે છે તેવી ચર્ચાએ જોર પકડ્યું હતું. જોકે ત્યારે તેમણે પોતાના રાજીનામાની વાતને પાયાવિહોણી ગણાવી હતી. તેમણે આ અંગે ગત 24 જાન્યુઆરી 2024ના રોજ પોતાના સોશિયલ મીડિયા પ્લેટફોર્મ X પર પોસ્ટ કરીને લખ્યું હતું કે ‘મારા કોઈ પણ ખુલાસા વિના વિવિધ મીડિયા ચેનલોમાં મારા ભાજપમાં જોડાઈ રહ્યાની વાતો થતી હતી. તેનો કોઈ આધાર નથી. હું કોંગ્રેસમાં છું અને પક્ષનો ચૂંટાયેલો ધારાસભ્ય છું.’ પરંતુ આજે આ અહેવાલો સાચા સાબિત થયા છે. અર્જુન મોઢવાડિયાએ આજે રાજીનામું આપી દીધું છે.
Vinfast VF3 Could Be The Cheapest Electric SUV In India
Vinfast is laying down its India plans and its intent to grab a big slice of the market is already known. As we have said before, Vinfast could start with a top-down approach and first launch a premium SUV but its volume player could be the car seen here with the Vinfast VF3. The VF3 is a small EV SUV which is larger than the MG Comet but would be the smallest.
The SUV measures 3,114 milimetres in length and has 16-inch wheels while having a good amount of ground clearance. The styling is compact and has a new grille with a black layout, unlike other Vinfast models.
The interiors are simple with a 10-inch touchscreen and climate control buttons below. Despite the compact body size, the VF3 has a boot capacity of 550 litres. The official range claimed for the VF3 is 200 kilometres while it remains to be seen what specifications the India spec VF3 could have.
Vinfast would have to aggressively localise the VF3 to meet the costs and produce VF3 at its Tamil Nadu plant.
To create a sizeable market share, the Vinfast VF3 would need to be within the sub Rs 10 lakh price bracket.
The car looks funky and the SUV proportions will appeal to car buyers while a decent enough range will enable it to compete with other EVs like the Tiago EV and the Comet EV. We expect the VF3 to be launched after its premium EV range.
Along with the VF3, the carmaker could also launch other EVs while India could also serve as an export base for the Vietnamese carmaker.
Nothing Phone 2a India price confirmed by CEO Carl Pei, it is better than expected
The Nothing Phone 2a is all set to launch in India on March 5 and ahead of the event, some of the details have already been confirmed in terms of features and design. The brand’s CEO, Carl Pei, has now revealed the India price of the upcoming Nothing Phone 2a device. It is very low, something that one might not be expecting. Here is everything you need to know.
In a video interacting with youngsters, Pei confirmed that the Nothing Phone 2a will be priced at around Rs 25,000 in India. Interestingly, users were guessing a price of more than Rs 40,000 and to surprise them, Pei confirmed that this 5G phone will be available at a much more affordable price, costing around Rs 25,000. But, this is not the exact price and we will get more details on the launch day.
It was recently revealed that the mid-range phone is made in India, which means that the Nothing Phone 2a is being manufactured in the country itself.
“With this move, the company aims to harness the rich manufacturing ecosystem of the country while investing in the local economy and creating job opportunities,” Nothing said.
The upcoming Nothing event will be live-streamed from an in-person gathering in Delhi. People who are interested in watching the event can head to the official YouTube channel of Nothing on the launch day, which is tomorrow.
As for the specifications, the upcoming Nothing Phone (2a) is rumored to sport a 6.7-inch FHD+ OLED display with a 120Hz refresh rate. Nothing has confirmed that it will be powered by the MediaTek Dimensity 7200 Pro SoC. On the rear, it may have a dual-camera setup consisting of a 50-megapixel primary sensor and a 50-megapixel ultra-wide-angle lens.
For selfies, it could feature a 32-megapixel front camera. The device is expected to come with 12GB RAM and a RAM booster. Running on NothingOS 2.5, based on Android 14, it might be fueled by a 4,500mAh battery with 45W fast charging support. We will be covering the event, so you can stay tuned to India Today Tech for all the updates.
Miss World 2024: Sini Shetty makes it to Top 20 in a black peplum gown
Miss World 2024: One of the largest beauty pageant competitions is on, and we are glued to know who the next Miss World will be. The event started on February 18 and will end on March 9. Miss World 2021 Karolina Bielawska of Poland will be presenting the crown of Miss World to her successor at the end of the event on March 9. The event is taking place at Jio World Convention Centre in Mumbai. In February 2023, Julia Morley, chairperson of the Miss World Organisation announced that the event will take place in United Arab Emirates. However, later it was decided that the event will be held at Jio World Convention Centre in Mumbai.
Sini Shetty dazzled in a Rocky Star gown
Sini Shetty is representing India at the 71st Miss World Pageant. Sini shared a set of pictures from the Top Model Competition held on Saturday. The pictures featured her in a stunning dazzling gown as she secured her place in the Top 20 in the competition. The model played muse to fashion designer Rocky Star and picked a stunning black gown for the competition. The attire featured a peplum styled top with a plunging neckline, and sleeveless details, secured with a belt and a silver buckle. The attire further cascaded into a floor sweeping black gown with bodycon details. ” Massive thanks to Rocky Star for this breathtaking outfit for last night’s Top Model competition. Walking the ramp in your design was an unforgettable experience,” read Sini’s caption. Take a look at her ensemble here.
Sini kept her accessories minimal as she added statement golden earrings to her look. The model wore her tresses open in voluminous wavy curls with a side part as she smiled with all her heart for the cameras. Sini opted for a minimal makeup look – nude eyeshadow, black eyeliner, black kohl, mascara-laden eyelashes, drawn eyebrows, contoured cheeks and a shade of nude lipstick. Sini Shetty was also announced the winner for the Best Designer Dress from Asia and Oceania.
Pat Cummins Breaks KL Rahul’s Record After Being Appointed As SRH’s New Captain For IPL 2024
Featured games of the Sunrisers Hyderabad
Star Australian pacer Pat Cummins, who is also the captain of Australia’s Test and ODI teams, was appointed as the new skipper of Sunrisers Hyderabad (SRH) on Monday (March 4) for the upcoming 2024 season of the Indian Premier League. The 30-year-old pacer, who was signed for Rs 20.75 crore in the IPL 2024 auction last year by the 2016 IPL champions, has replaced Aiden Markram. Markram captained SRH in 13 matches of the IPL 2023 but was only able to win four matches.
He was expected to retain his job after leading SRH’s sister franchise Sunrisers Eastern Cape to the SA20 title last month, but it didn’t happen, and the Sunrisers owners chose to replace him with Cummins, who led Australia to the ODI World Cup as well as the World Test Championship title in 2023.
After being appointed as the 10th captain of SRH in IPL history on Monday, Cummins broke an elite record of star Indian batter KL Rahul. The right-arm pacer has now become the highest-paid captain in IPL history. Before him, the record was held by KL Rahul, who joined the Lucknow Super Giants for Rs 17 crore ahead of the IPL 2022 mega auction and captained the franchise in IPL 2022 and 2023.
Virat Kohli, who is the highest run scorer in IPL history, also used to pocket Rs 17 crore as captain in the 2018, 2019, 2020, and 2021 seasons of the cash-rich league. But unlike Rahul, he was retained for that amount by the Royal Challengers Bangalore.
Before being signed for Rs 20.75 crore in the IPL 2024 auction by SRH, Cummins played in the IPL for teams like the Delhi Capitals (formerly Delhi Daredevils) and Kolkata Knight Riders. In 42 matches, he scored 379 runs and picked up 45 wickets. He holds the record for scoring the fastest fifty in IPL history by a KKR batter. During the IPL 2022 match against the Mumbai Indians in Pune on April 6, 2022, he completed his fifty in just 14 balls.
CBSE Board Exam 2024 Live: Class 12th Physics tougher than past years
CBSE Board Exam 2024 Live Updates: The Central Board of Secondary Education (CBSE) conducted the Class 12 Physics paper for Science stream students today, March 4. The was held from 10:30 am to 1:30 pm. Meanwhile, Class 10 students appeared for Home Science and Multi Skill Foundation Course exams.
The Physics theory paper is for 70 marks and as per the sample paper, it should carry 33 questions divided into five sections. Section A will have MCQs and Assertion Reasoning-based questions of 1 mark each. Section B has five questions of two marks each, C has seven questions of three marks each, D has two case-study questions of four marks each and E has three long answer questions of five marks each, in the sample paper. Candidates are not allowed to use calculators in the examination.
Over 39 lakh students are appearing for the CBSE board exams this year. The exams started on February 15. Class 10 exams will end on March 13 and Class 12 final exams will conclude on April 2.
Check CBSE Class 12 Physics paper analysis updates below:
છે ને ખરી નોટ! 9 થી 5ની નોકરી માંથી રિઝાઇન આપી એવો હરખાય ગયો વ્યક્તિ, વીડિયો થયો વાયરલ
નોકરી છોડ્યા પછી તમે કોઈને સેલિબ્રેશન કરતા જોયા છે? પરંતુ આજકાલ એક એવી વ્યક્તિ ચર્ચામાં છે, જેણે પોતાની 9-5 નોકરી છોડી દીધી અને આનંદમાં રસ્તાઓ પર નાચવા લાગ્યો. આ વ્યક્તિ ફ્રાન્સની હોવાનું કહેવાય છે, જે સોશિયલ મીડિયા ઇનફલૂઆન્સર છે.
Maulik Narola Updated on: Mar 03, 2024 | 8:33 PM
નોકરી કરવી પણ દરેક વ્યક્તિના બસની વાત નથી હોતી, કારણ કે તેમાં અનુકૂલન અને ટકી રહેવા દરમિયાન, લોકોની સ્થિતિ ઘણીવાર ખરાબ થઈ જાય છે. ક્યારેક કોઈને તેની ઈચ્છા મુજબનો પગાર મળતો નથી તો ક્યારેક સારું કામ કરવા છતાં લોકોને બોસ ઠપકો આપે છે.
ઘણી વખત એવું બને છે કે લોકોને ઓફિસ જવાનું મન થતું નથી, પરંતુ તેમ છતાં તેમને જવું પડે છે, કારણ કે તેમને બોસ તરફથી રજા મળતી નથી. જો કે, ઘણા લોકો હિંમત એકઠી કરે છે અને આ 9-5 કામ છોડી દે છે અને કેટલાક પોતાનું કામ કરવાનો પ્રયાસ કરે છે, જે તેમને ખુશી આપી શકે છે. આજકાલ આવા જ એક વ્યક્તિનો વીડિયો સોશિયલ મીડિયા પર વાયરલ થઈ રહ્યો છે.
વાસ્તવમાં, ફ્રાંસના આ વ્યક્તિએ 9-5ની નોકરી છોડતાની સાથે જ તેણે રસ્તાઓ પર ઝૂમીને ઉજવણી કરી હતી. એવું લાગતું હતું કે તેણે નોકરી છોડી નથી પણ લોટરી જીતી છે. વીડિયોમાં તમે જોઈ શકો છો કે કેવી રીતે તે વ્યક્તિ કાનમાં ઈયરફોન લગાવીને ડાન્સ કરી રહ્યો છે જાણે તેને દુનિયાની બધી ખુશીઓ મળી ગઈ હોય. વાસ્તવમાં, આ વ્યક્તિએ તેની નોકરી છોડી દીધી છે કારણ કે તે સોશિયલ મીડિયા માટે કન્ટેન્ટ બનાવે છે અને તે તેની નોકરીની સાથે બંને કામ કરવામા સક્ષમ ન હતો.
હવે કન્ટેન્ટ બનાવવો તેનો શોખ હતો અને તેમાં જ તેને ખરો આનંદ મળ્યો તેથી તેણે કાયમ માટે નોકરી છોડી દીધી.
સોશિયલ મીડિયા પર એક ડિલિવરી એજન્ટનો વીડિયો વાયરલ થઈ રહ્યો છે, તેને જોઈને લોકો ગુસ્સે થઈ ગયા છે. વાસ્તવમાં, એક ડિલિવરી એજન્ટ સામાનની ડિલિવરી કરવા માટે એક વ્યક્તિના ઘરે આવ્યો હતો અને સામાનને દરવાજા પાસે રાખ્યો હતો, ફોટો પાડ્યો હતો અને પછી તેને તેની સાથે પાછો લઈ ગયો હતો.
maulik narola ;
આજકાલ કોઈ પણ વસ્તુ ઓનલાઈન ઓર્ડર કરવી એ ફેશનની સાથે સાથે લોકોની જરૂરિયાત પણ બની ગઈ છે. એક સમય હતો જ્યારે લોકો સામાન ખરીદવા બજારમાં જતા હતા અને પછી ડિસ્કાઉન્ટ માટે દુકાનદારો સાથે સ્પર્ધા કરવી પડતી હતી, પરંતુ ઓનલાઈન આવી કોઈ ઝંઝટ નથી.
ઓનલાઈન શોપિંગ એપ્સ પર તમે માંગ્યા વગર પણ ભારે ડિસ્કાઉન્ટ પર ઘણી વસ્તુઓ મેળવી શકો છો. જો કે આ ઓનલાઈન ખરીદીમાં ઘણી વખત લોકો છેતરાઈ પણ જાય છે. ક્યારેક પેકિંગ કરનારા લોકો છેતરે છે તો ક્યારેક ડિલિવરી એજન્ટો લોકોને છેતરે છે. આનાથી સંબંધિત એક વીડિયો આ દિવસોમાં સોશિયલ મીડિયા પર વાયરલ થઈ રહ્યો છે, જે ખૂબ જ આશ્ચર્યજનક છે.
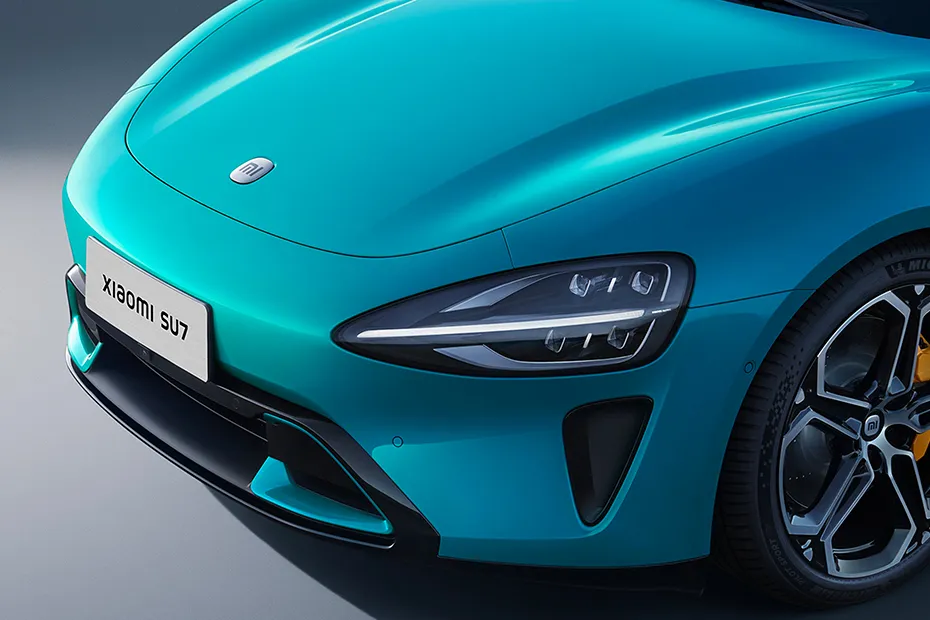
The SU7 is Xiaomi’s bold entry into the electric car world to take on stalwarts such as the Tesla Model 3 and Porsche Taycan
Xiaomi first announced EV plans back in 2021 with investments of USD 10 billion over the next decade.
The SU7’s exterior is highlighted by the connected taillights, teardrop-shaped LED headlights and up to 20-inch alloy wheels.
Cabin has a minimalistic appeal comprising only a 3-spoke steering wheel and digital screens.
Features on board include a 16.1-inch touchscreen, a 56-inch heads-up display and ADAS.
Gets 73.6 kWh and 101 kWh battery packs with rear-wheel drive and all-wheel drive options.
Global launch expected in 2024; could come to India at some point in the future.
When one thinks of Xiaomi, the first thing that comes to mind is smartphones. Although the Chinese tech giant majorly masters in consumer electronic devices, it has had a history of bringing out new products completely different from its mainstream offerings ranging from lifestyle to home appliances. In line with a growing trend regarding EVs, back in 2021, Xiaomi had announced its plans to further diversify its portfolio by trying its hands at the electric car space with a plan to invest USD 10 billion over the next 10 years. That has now resulted in the conceptualisation of the SU7 – Xiaomi’s first electric car – which will be offered in two variants: SU7 and SU7 Max.
The SU7’s Design
Bucking the trend of SUVs and crossovers, the Xiaomi SU7 is an electric sedan. Its low-slung design will remind you of other, already produced electric sedans such as the Hyundai Ioniq 6, Porsche Taycan, and Tesla Model 3. Exterior highlights include teardrop-shaped LED headlights, a pop-up rear spoiler, up to 20-inch alloy wheels, connected LED taillights, and sporty bumpers.
Car Loan Through CarDekho
Doorstep Car Service
Interior And Feature Details
Although the tech brand hasn’t showcased the physical cabin of its electric car, previous international spy shots and renders suggested that it offers a minimalist cabin made up of a 3-spoke steering wheel and two digital displays with no cluttered control panels. Its cabin is likely to have different themes (possibly between red, white, and black and grey) based on the variant chosen.
Features on board the SU7 include a 16.1-inch free-floating touchscreen system, a 25-speaker music system, and a 56-inch heads-up display. Xiaomi has also provided it with connected car tech, rear entertainment displays, front and rear parking sensors, and advanced driver assistance systems (ADAS).
Also Read: Foxconn Eyes India For Its EV-making Plans
What About Its Electric Powertrain?
Xiaomi will offer the SU7 with two battery pack options: 73.6 kWh (SU7) and 101 kWh (SU7 Max). The SU7 has a 299 PS single-motor setup with rear-wheel-drive (RWD), while the other offers a 673 PS dual-motor setup with all-wheel-drive (AWD). Their claimed range figures stand at 668 km and 800 km, respectively.
Also Check Out: 7 Tips To Protect Your Car When Stuck In Traffic
Global Launch And Rivals
We believe Xiaomi will first launch the EV in its home market in 2024 and might even consider bringing it to our shores. The SU7 is a competitor to the likes of the Porsche Taycan, Tesla Model 3, and Hyundai Ioniq 6.
About The Place: The main draw for tourists coming to Dwarka, the Dwarkadhish Temple (Jagat Mandir), is believed to have been established more than 2500 years ago by Lord Krishna’s great grandson, Vajranabh. The ancient temple has been renovated several times, especially leaving imprints of 16th and 19th centuries. The temple stands on a small hill accessed by 50 plus steps, with heavily sculptured walls that cocoon the sanctum with the main Krishna idol. Around the complex lie other smaller shrines. The walls have intricately carved mythical characters and legends. The impressive 43 m high spire is topped with a flag made from 52 yards of cloth that flutters in the soft breeze from the Arabian Sea behind the temple. There are two doors (swarg and moksh) for the entry and exit of the temple. A bridge called Sudama Setu (7am–1pm, 4–7.30pm) at the base of the temple takes one across the Gomti creek towards the beach.
Brief History: Dwarka on the western tip of the Kathiawar Peninsula is clubbed with the holiest sites in India – the Char Dhams that include Badrinath, Puri and Rameshwaram. It is believed that Lord Krishna arrived here from Braj in Uttar Pradesh to build the city. The temple was established by his grandson. It is at the cusp of the Gomti River and the Arabian Sea, providing a scenic backdrop to the spiritual site. It is said that Dwarka was submerged under the sea six times and what we see now is its seventh avatar. The temple itself has a fascinating legend. The original structure was destroyed by Mahmud Begada in 1472, and subsequently rebuilt in the 15th-16th century. It was also feted by Adi Shankaracharya, the 8th century Hindu theologian and philosopher.
Best time to visit: The best time to visit is between November and February, and during Janmashtami which is celebrated grandly here.
Dwarkadhish Temple
Lord Sri Krishna temple in Gomati coast is holy, which temple is known as DWARKADHISH Temple. According to the opinion of the Department of Archaeology, This temple is 1200 years old. Logically estimated one great-grandson of Lord Sri Krishna Vajranabhe Earlier, around 1400 BCE samudrama dubhi surviving remnant of the house of umbrellas established.
The main temple at Dwarka, situated on Gomti creek, is known as jagat mandir (universal shrine) or trilok sundar (the most beautiful in all the three worlds). Originally believed to be built by Vajranabh, the great grandson of Lord Krishna, more than 2500 years ago, it is a glorious structure seeming to rise from the waters of the Arabian Sea. Its exquisitely carved shikhar, reaching 43 m high and the huge flag made from 52 yards of cloth, can be seen from as far away as 10 km. The grandeur of the temple is enhanced by the flight of 56 steps leading to the rear side of the edifice on the side of the river Gomti.
The temple is built of soft limestone and consists of a sanctum, vestibule and a rectangular hall with porches on three sides. There are two gateways: swarga dwar (gate to the heavens), where pilgrims enter, and moksha dwar (gate to liberation), where pilgrims exit.
The Future of World Religions: Population Growth Projections 2010-2050,Why Muslims Are Rising Fastest and the Unaffiliated Are Shrinking as a Share of the World’s Population
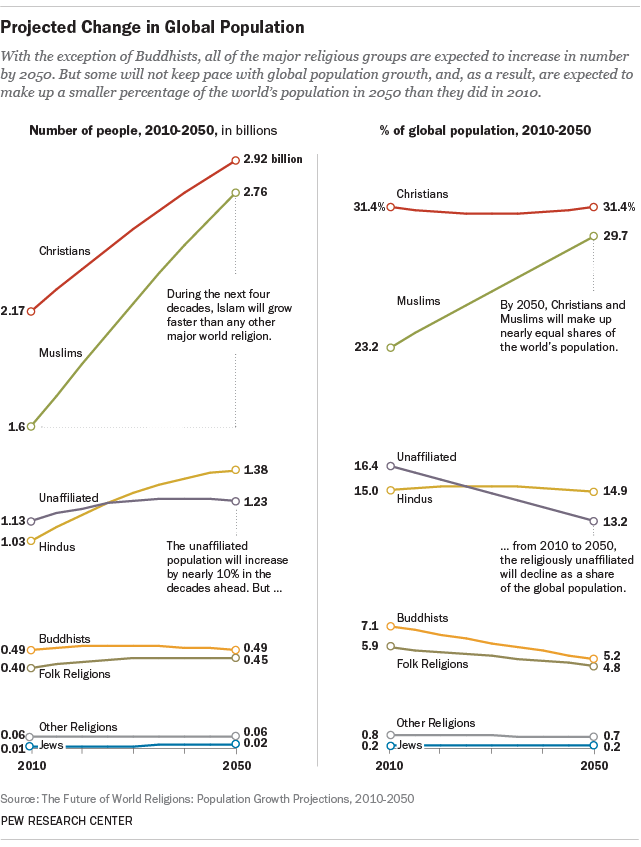
The religious profile of the world is rapidly changing, driven primarily by differences in fertility rates and the size of youth populations among the world’s major religions, as well as by people switching faiths. Over the next four decades, Christians will remain the largest religious group, but Islam will grow faster than any other major religion. If current trends continue, by 2050 …
The number of Muslims will nearly equal the number of Christians around the world.
Atheists, agnostics and other people who do not affiliate with any religion – though increasing in countries such as the United States and France – will make up a declining share of the world’s total population.
The global Buddhist population will be about the same size it was in 2010, while the Hindu and Jewish populations will be larger than they are today.
In Europe, Muslims will make up 10% of the overall population.
India will retain a Hindu majority but also will have the largest Muslim population of any country in the world, surpassing Indonesia.
In the United States, Christians will decline from more than three-quarters of the population in 2010 to two-thirds in 2050, and Judaism will no longer be the largest non-Christian religion. Muslims will be more numerous in the U.S. than people who identify as Jewish on the basis of religion.
Four out of every 10 Christians in the world will live in sub-Saharan Africa.
These are among the global religious trends highlighted in new demographic projections by the Pew Research Center. The projections take into account the current size and geographic distribution of the world’s major religions, age differences, fertility and mortality rates, international migration and patterns in conversion.
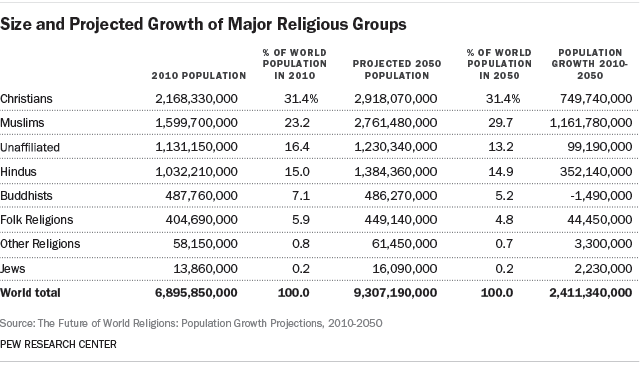
As of 2010, Christianity was by far the world’s largest religion, with an estimated 2.2 billion adherents, nearly a third (31%) of all 6.9 billion people on Earth. Islam was second, with 1.6 billion adherents, or 23% of the global population.
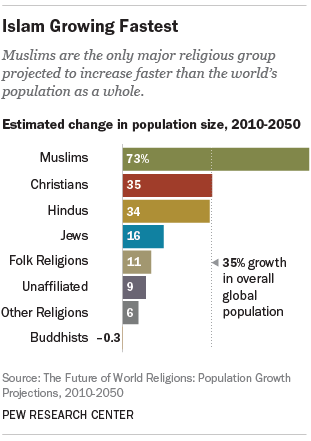
If current demographic trends continue, however, Islam will nearly catch up by the middle of the 21st century. Between 2010 and 2050, the world’s total population is expected to rise to 9.3 billion, a 35% increase. Over that same period, Muslims – a comparatively youthful population with high fertility rates – are projected to increase by 73%. The number of Christians also is projected to rise, but more slowly, at about the same rate (35%) as the global population overall.
As a result, according to the Pew Research projections, by 2050 there will be near parity between Muslims (2.8 billion, or 30% of the population) and Christians (2.9 billion, or 31%), possibly for the first time in history.
With the exception of Buddhists, all of the world’s major religious groups are poised for at least some growth in absolute numbers in the coming decades. The global Buddhist population is expected to be fairly stable because of low fertility rates and aging populations in countries such as China, Thailand and Japan.
Worldwide, the Hindu population is projected to rise by 34%, from a little over 1 billion to nearly 1.4 billion, roughly keeping pace with overall population growth. Jews, the smallest religious group for which separate projections were made, are expected to grow 16%, from a little less than 14 million in 2010 to 16.1 million worldwide in 2050.
Adherents of various folk religions – including African traditional religions, Chinese folk religions, Native American religions and Australian aboriginal religions – are projected to increase by 11%, from 405 million to nearly 450 million.
And all other religions combined – an umbrella category that includes Baha’is, Jains, Sikhs, Taoists and many smaller faiths – are projected to increase 6%, from a total of approximately 58 million to more than 61 million over the same period.
While growing in absolute size, however, folk religions, Judaism and “other religions” (the umbrella category considered as a whole) will not keep pace with global population growth. Each of these groups is projected to make up a smaller percentage of the world’s population in 2050 than it did in 2010.
Similarly, the religiously unaffiliated population is projected to shrink as a percentage of the global population, even though it will increase in absolute number. In 2010, censuses and surveys indicate, there were about 1.1 billion atheists, agnostics and people who do not identify with any particular religion. By 2050, the unaffiliated population is expected to exceed 1.2 billion. But, as a share of all the people in the world, those with no religious affiliation are projected to decline from 16% in 2010 to 13% by the middle of this century.
At the same time, however, the unaffiliated are expected to continue to increase as a share of the population in much of Europe and North America. In the United States, for example, the unaffiliated are projected to grow from an estimated 16% of the total population (including children) in 2010 to 26% in 2050.
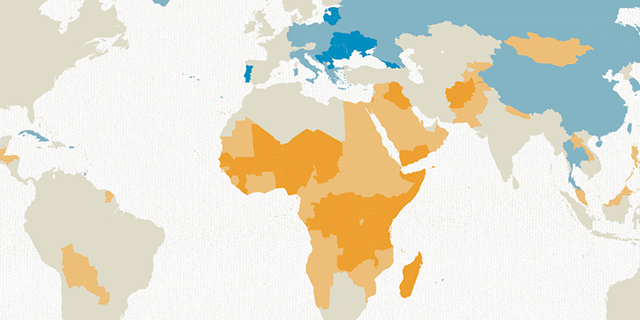
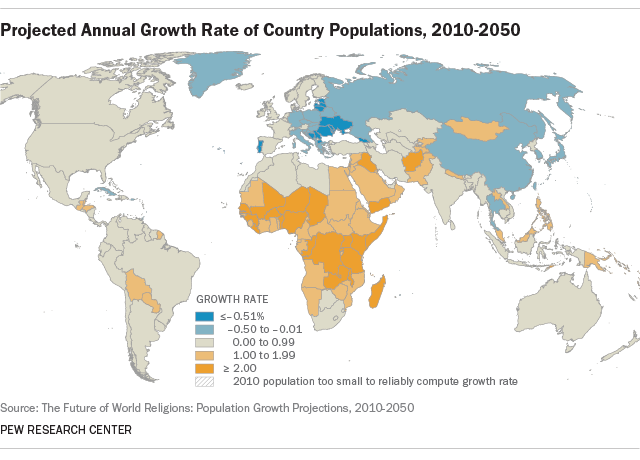
As the example of the unaffiliated shows, there will be vivid geographic differences in patterns of religious growth in the coming decades. One of the main determinants of that future growth is where each group is geographically concentrated today. Religions with many adherents in developing countries – where birth rates are high, and infant mortality rates generally have been falling – are likely to grow quickly. Much of the worldwide growth of Islam and Christianity, for example, is expected to take place in sub-Saharan Africa. Today’s religiously unaffiliated population, by contrast, is heavily concentrated in places with low fertility and aging populations, such as Europe, North America, China and Japan.
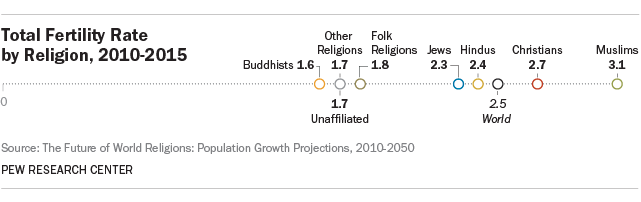
Globally, Muslims have the highest fertility rate, an average of 3.1 children per woman – well above replacement level (2.1), the minimum typically needed to maintain a stable population. Christians are second, at 2.7 children per woman. Hindu fertility (2.4) is similar to the global average (2.5). Worldwide, Jewish fertility (2.3 children per woman) also is above replacement level. All the other groups have fertility levels too low to sustain their populations: folk religions (1.8 children per woman), other religions (1.7), the unaffiliated (1.7) and Buddhists (1.6).
Another important determinant of growth is the current age distribution of each religious group – whether its adherents are predominantly young, with their prime childbearing years still ahead, or older and largely past their childbearing years.
In 2010, more than a quarter of the world’s total population (27%) was under the age of 15. But an even higher percentage of Muslims (34%) and Hindus (30%) were younger than 15, while the share of Christians under 15 matched the global average (27%). These bulging youth populations are among the reasons that Muslims are projected to grow faster than the world’s overall population and that Hindus and Christians are projected to roughly keep pace with worldwide population growth.
All the remaining groups have smaller-than-average youth populations, and many of them have disproportionately large numbers of adherents over the age of 59. For example, 11% of the world’s population was at least 60 years old in 2010. But fully 20% of Jews around the world are 60 or older, as are 15% of Buddhists, 14% of Christians, 14% of adherents of other religions (taken as a whole), 13% of the unaffiliated and 11% of adherents of folk religions. By contrast, just 7% of Muslims and 8% of Hindus are in this oldest age category.
In addition to fertility rates and age distributions, religious switching is likely to play a role in the growth of religious groups. But conversion patterns are complex and varied. In some countries, it is fairly common for adults to leave their childhood religion and switch to another faith. In others, changes in religious identity are rare, legally cumbersome or even illegal.
The Pew Research Center projections attempt to incorporate patterns in religious switching in 70 countries where surveys provide information on the number of people who say they no longer belong to the religious group in which they were raised. In the projection model, all directions of switching are possible, and they may be partially offsetting. In the United States, for example, surveys find that some people who were raised with no religious affiliation have switched to become Christians, while some who grew up as Christians have switched to become unaffiliated. These types of patterns are projected to continue as future generations come of age. (For more details on how and where switching was modeled, see the Methodology. For alternative growth scenarios involving either switching in additional countries or no switching at all, see Chapter 1.)
Over the coming decades, Christians are expected to experience the largest net losses from switching. Globally, about 40 million people are projected to switch into Christianity, while 106 million are projected to leave, with most joining the ranks of the religiously unaffiliated. (See chart above.)
All told, the unaffiliated are expected to add 97 million people and lose 36 million via switching, for a net gain of 61 million by 2050. Modest net gains through switching also are expected for Muslims (3 million), adherents of folk religions (3 million) and members of other religions (2 million). Jews are expected to experience a net loss of about 300,000 people due to switching, while Buddhists are expected to lose nearly 3 million.
International migration is another factor that will influence the projected size of religious groups in various regions and countries.
Forecasting future migration patterns is difficult, because migration is often linked to government policies and international events that can change quickly. For this reason, many population projections do not include migration in their models. But working with researchers at the International Institute for Applied Systems Analysis in Laxenburg, Austria, the Pew Research Center has developed an innovative way of using data on past migration patterns to estimate the religious composition of migrant flows in the decades ahead. (For details on how the projections were made, see Chapter 1.)
The impact of migration can be seen in the examples shown in the graph at the right, which compares projection scenarios with and without migration in the regions where it will have the greatest impact. In Europe, for instance, the Muslim share of the population is expected to increase from 5.9% in 2010 to 10.2% in 2050 when migration is taken into account along with other demographic factors that are driving population change, such as fertility rates and age. Without migration, the Muslim share of Europe’s population in 2050 is projected to be nearly two percentage points lower (8.4%). In North America, the Hindu share of the population is expected to nearly double in the decades ahead, from 0.7% in 2010 to 1.3% in 2050, when migration is included in the projection models. Without migration, the Hindu share of the region’s population would remain about the same (0.8%).
In the Middle East and North Africa, the continued migration of Christians into the six Gulf Cooperation Council (GCC) countries (Bahrain, Kuwait, Oman, Qatar, Saudi Arabia and the United Arab Emirates) is expected to offset the exodus of Christians from other countries in the region.7 If migration were not factored into the 2050 projections, the estimated Christian share of the region’s population would drop below 3%. With migration factored in, however, the estimated Christian share is expected to be just above 3% (down from nearly 4% in 2010).
Beyond the Year 2050
This report describes how the global religious landscape would change if current demographic trends continue. With each passing year, however, there is a chance that unforeseen events – war, famine, disease, technological innovation, political upheaval, etc. – will alter the size of one religious group or another. Owing to the difficulty of peering more than a few decades into the future, the projections stop at 2050.
Readers may wonder, though, what would happen to the population trajectories highlighted in this report if they were projected into the second half of this century. Given the rapid projected increase from 2010 to 2050 in the Muslim share of the world’s population, would Muslims eventually outnumber Christians? And, if so, when?
The answer depends on continuation of the trends described in Chapter 1. If the main projection model is extended beyond 2050, the Muslim share of the world’s population would equal the Christian share, at roughly 32% each, around 2070. After that, the number of Muslims would exceed the number of Christians, but both religious groups would grow, roughly in tandem, as shown in the graph above. By the year 2100, about 1% more of the world’s population would be Muslim (35%) than Christian (34%).
The projected growth of Muslims and Christians would be driven largely by the continued expansion of Africa’s population. Due to the heavy concentration of Christians and Muslims in this high-fertility region, both groups would increase as a percentage of the global population. Combined, the world’s two largest religious groups would make up more than two-thirds of the global population in 2100 (69%), up from 61% in 2050 and 55% in 2010.
It bears repeating, however, that many factors could alter these trajectories. For example, if a large share of China’s population were to switch to Christianity (as discussed in this sidebar), that shift alone could bolster Christianity’s current position as the world’s most populous religion. Or if disaffiliation were to become common in countries with large Muslim populations – as it is now in some countries with large Christian populations – that trend could slow or reverse the increase in Muslim numbers.
Regional and Country-Level Projections
In addition to making projections at the global level, this report projects religious change in 198 countries and territories with at least 100,000 people as of 2010, covering 99.9% of the world’s population. Population estimates for an additional 36 countries and territories are included in regional and global totals throughout the report. The report also divides the world into six major regions and looks at how each region’s religious composition is likely to change from 2010 to 2050, assuming that current patterns in migration and other demographic trends continue.8
Due largely to high fertility, sub-Saharan Africa is projected to experience the fastest overall growth, rising from 12% of the world’s population in 2010 to about 20% in 2050. The Middle East-North Africa region also is expected to grow faster than the world as a whole, edging up from 5% of the global population in 2010 to 6% in 2050. Ongoing growth in both regions will fuel global increases in the Muslim population. In addition, sub-Saharan Africa’s Christian population is expected to double, from 517 million in 2010 to 1.1 billion in 2050. The share of the world’s Christians living in sub-Saharan Africa will rise from 24% in 2010 to 38% in 2050.
Meanwhile, the Asia-Pacific region is expected to have a declining share of the world’s population (53% in 2050, compared with 59% in 2010). This will be reflected in the slower growth of religions heavily concentrated in the region, including Buddhism and Chinese folk religions, as well as slower growth of Asia’s large unaffiliated population. One exception is Hindus, who are overwhelmingly concentrated in India, where the population is younger and fertility rates are higher than in China or Japan. As previously mentioned, Hindus are projected to roughly keep pace with global population growth. India’s large Muslim population also is poised for rapid growth. Although India will continue to have a Hindu majority, by 2050 it is projected to have the world’s largest Muslim population, surpassing Indonesia.
The remaining geographic regions also will contain declining shares of the world’s population: Europe is projected to go from 11% to 8%, Latin American and the Caribbean from 9% to 8%, and North America from 5% to a little less than 5%.
Europe is the only region where the total population is projected to decline. Europe’s Christian population is expected to shrink by about 100 million people in the coming decades, dropping from 553 million to 454 million. While Christians will remain the largest religious group in Europe, they are projected to drop from three-quarters of the population to less than two-thirds. By 2050, nearly a quarter of Europeans (23%) are expected to have no religious affiliation, and Muslims will make up about 10% of the region’s population, up from 5.9% in 2010. Over the same period, the number of Hindus in Europe is expected to roughly double, from a little under 1.4 million (0.2% of Europe’s population) to nearly 2.7 million (o.4%), mainly as a result of immigration. Buddhists appear headed for similarly rapid growth in Europe – a projected rise from 1.4 million to 2.5 million.
In North America, Muslims and followers of “other religions” are the fastest-growing religious groups. In the United States, for example, the share of the population that belongs to other religions is projected to more than double – albeit from a very small base – rising from 0.6% to 1.5%. Christians are projected to decline from 78% of the U.S. population in 2010 to 66% in 2050, while the unaffiliated are expected to rise from 16% to 26%. And by the middle of the 21st century, the United States is likely to have more Muslims (2.1% of the population) than people who identify with the Jewish faith (1.4%).
In Latin America and the Caribbean, Christians will remain the largest religious group, making up 89% of the population in 2050, down slightly from 90% in 2010. Latin America’s religiously unaffiliated population is projected to grow both in absolute number and percentage terms, rising from about 45 million people (8%) in 2010 to 65 million (9%) in 2050.
Changing Religious Majorities
Several countries are projected to have a different religious majority in 2050 than they did in 2010. The number of countries with Christian majorities is expected to decline from 159 to 151, as Christians are projected to drop below 50% of the population in Australia, Benin, Bosnia-Herzegovina, France, the Netherlands, New Zealand, the Republic of Macedonia and the United Kingdom.
Muslims in 2050 are expected to make up more than 50% of the population in 51 countries, two more than in 2010, as both the Republic of Macedonia and Nigeria are projected to gain Muslim majorities. But Nigeria also will continue to have a very large Christian population. Indeed, Nigeria is projected to have the third-largest Christian population in the world by 2050, after the United States and Brazil.
As of 2050, the largest religious group in France, New Zealand and the Netherlands is expected to be the unaffiliated.
About These Projections
While many people have offered predictions about the future of religion, these are the first formal demographic projections using data on age, fertility, mortality, migration and religious switching for multiple religious groups around the world. Demographers at the Pew Research Center in Washington, D.C., and the International Institute for Applied Systems Analysis (IIASA) in Laxenburg, Austria, gathered the input data from more than 2,500 censuses, surveys and population registers, an effort that has taken six years and will continue.
The projections cover eight major groups: Buddhists, Christians, Hindus, Jews, Muslims, adherents of folk religions, adherents of other religions and the unaffiliated (see Appendix C: Defining the Religious Groups). Because censuses and surveys in many countries do not provide information on religious subgroups – such as Sunni and Shia Muslims or Catholic, Protestant and Orthodox Christians – the projections are for each religious group as a whole. Data on subgroups of the unaffiliated are also unavailable in many countries. As a result, separate projections are not possible for atheists or agnostics.
The projection model was developed in collaboration with researchers in the Age and Cohort Change Project at IIASA, who are world leaders in population projections methodology. The model uses an advanced version of the cohort-component method typically employed by demographers to forecast population growth. It starts with a population of baseline age groups, or cohorts, divided by sex and religion. Each cohort is projected into the future by adding likely gains (immigrants and people switching in) and by subtracting likely losses (deaths, emigrants and people switching out) year by year. The youngest cohorts, ages 0-4, are created by applying age-specific fertility rates to each female cohort in the childbearing years (ages 15-49), with children inheriting the mother’s religion. For more details, see the Methodology.
In the process of gathering input data and developing the projection model, the Pew Research Center previously published reports on the current size and geographic distribution of major religious groups, including Muslims (2009), Christians (2011) and several other faiths (2012). An initial set of projections for one religious group, Muslims, was published in 2011, although it did not attempt to take religious switching into account.
Some social theorists have suggested that as countries develop economically, more of their inhabitants will move away from religious affiliation. While that has been the general experience in some parts of the world, notably Europe, it is not yet clear whether it is a universal pattern. In any case, the projections in this report are not based on theories about economic development leading to secularization.
Rather, the projections extend the recently observed patterns of religious switching in all countries for which sufficient data are available (70 countries in all). In addition, the projections reflect the United Nations’ expectation that in countries with high fertility rates, those rates gradually will decline in coming decades, alongside rising female educational attainment. And the projections assume that people gradually are living longer in most countries. These and other key input data and assumptions are explained in detail in Chapter 1 and the Methodology (Appendix A).
Since religious change has never previously been projected on this scale, some cautionary words are in order. Population projections are estimates built on current population data and assumptions about demographic trends, such as declining birth rates and rising life expectancies in particular countries. The projections are what will occur if the current data are accurate and current trends continue. But many events – scientific discoveries, armed conflicts, social movements, political upheavals, natural disasters and changing economic conditions, to name just a few – can shift demographic trends in unforeseen ways. That is why the projections are limited to a 40-year time frame, and subsequent chapters of this report try to give a sense of how much difference it could make if key assumptions were different.
For example, China’s 1.3 billion people (as of 2010) loom very large in global trends. At present, about 5% of China’s population is estimated to be Christian, and more than 50% is religiously unaffiliated. Because reliable figures on religious switching in China are not available, the projections do not contain any forecast for conversions in the world’s most populous country. But if Christianity expands in China in the decades to come – as some experts predict – then by 2050, the global numbers of Christians may be higher than projected, and the decline in the percentage of the world’s population that is religiously unaffiliated may be even sharper. (For more details on the possible impact of religious switching in China, see Chapter 1.)
Finally, readers should bear in mind that within every major religious group, there is a spectrum of belief and practice. The projections are based on the number of people who self-identify with each religious group, regardless of their level of observance. What it means to be Christian, Muslim, Hindu, Buddhist, Jewish or a member of any other faith may vary from person to person, country to country, and decade to decade.
Acknowledgements
These population projections were produced by the Pew Research Center as part of the Pew-Templeton Global Religious Futures project, which analyzes religious change and its impact on societies around the world. Funding for the Global Religious Futures project comes from The Pew Charitable Trusts and the John Templeton Foundation.
Many staff members in the Pew Research Center’s Religion & Public Life project contributed to this effort. Conrad Hackett was the lead researcher and primary author of this report. Alan Cooperman served as lead editor. Anne Shi and Juan Carlos Esparza Ochoa made major contributions to data collection, storage and analysis. Bill Webster created the graphics and Stacy Rosenberg and Ben Wormald oversaw development of the interactive data presentations and the Global Religious Futures website. Sandra Stencel, Greg Smith, Michael Lipka and Aleksandra Sandstrom provided editorial assistance. The report was number-checked by Shi, Esparza Ochoa, Claire Gecewicz and Angelina Theodorou.
Several researchers in the Age and Cohort Change project of the International Institute for Applied Systems Analysis collaborated on the projections, providing invaluable expertise on advanced (“multistate”) population modeling and standardization of input data. Marcin Stonawski wrote the cutting-edge software used for these projections and led the collection and analysis of European data. Michaela Potančoková standardized the fertility data. Vegard Skirbekk coordinated IIASA’s research contributions. Additionally, Guy Abel at the Vienna Institute of Demography helped construct the country-level migration flow data used in the projections.
Over the past six years, a number of former Pew Research Center staff members also played critical roles in producing the population projections. Phillip Connor prepared the migration input data, wrote descriptions of migration results and methods, and helped write the chapters on each religious group and geographic region. Noble Kuriakose was involved in nearly all stages of the project and helped draft the chapter on demographic factors and the Methodology. Former intern Joseph Naylor helped design maps, and David McClendon, another former intern, helped research global patterns of religious switching. The original concept for this study was developed by Luis Lugo, former director of the Pew Research Center’s Religion & Public Life project, with assistance from former senior researcher Brian J. Grim and visiting senior research fellow Mehtab Karim.
Others at the Pew Research Center who provided editorial or research guidance include Michael Dimock, Claudia Deane, Scott Keeter, Jeffrey S. Passel and D’Vera Cohn. Communications support was provided by Katherine Ritchey and Russ Oates.
We also received very helpful advice and feedback on portions of this report from Nicholas Eberstadt, Henry Wendt Scholar in Political Economy, American Enterprise Institute; Roger Finke, Director of the Association of Religion Data Archives and Distinguished Professor of Sociology and Religious Studies, The Pennsylvania State University; Carl Haub, Senior Demographer, Population Reference Bureau; Todd Johnson, Associate Professor of Global Christianity and Director of the Center for the Study of Global Christianity, Gordon Conwell Theological Seminary; Ariela Keysar, Associate Research Professor and Associate Director of the Institute for the Study of Secularism in Society and Culture, Trinity College; Chaeyoon Lim, Associate Professor of Sociology, University of Wisconsin-Madison; Arland Thornton, Research Professor in the Population Studies Center, University of Michigan; Jenny Trinitapoli, Assistant Professor of Sociology, Demography and Religious Studies, The Pennsylvania State University; David Voas, Professor of Population Studies and Acting Director of the Institute for Social and Economic Research, University of Essex; Robert Wuthnow, Andlinger Professor of Sociology and Director of the Center for the Study of Religion, Princeton University; and Fenggang Yang, Professor of Sociology and Director of the Center on Religion and Chinese Society, Purdue University.
While the data collection and projection methodology were guided by our consultants and advisers, the Pew Research Center is solely responsible for the interpretation and reporting of the data.
Roadmap to the Report
The remainder of this report details the projections from multiple angles. The first chapter looks at the demographic factors that shape the projections, including sections on fertility rates, life expectancy, age structure, religious switching and migration. The next chapter details projections by religious group, with separate sections on Christians, Muslims, the religiously unaffiliated, Hindus, Buddhists, adherents of folk or traditional religions, members of “other religions” (consolidated into a single group) and Jews. A final chapter takes a region-by-region look at the projections, including separate sections on Asia and the Pacific, Europe, Latin America and the Caribbean, the Middle East and North Africa, North America and sub-Saharan Africa.
As we are in the 21st century and the mobiles and cell phones have become regarded as the century icon. Mobile phones have come a long way, they are the most used devices in the world and the growth of the mobile industry has been amazing and this has been an astonishing achievement for the industry. The growth of the mobile industry has opened doors for many entrepreneurs; however, startups must also hold with the dynamical trends, purchaser behavior, and strategies of companies like Google, Apple, Microsoft in the corporate field. If a startup knows this Enhancement, then this would help them grasp the great opportunity while lessening risk from potential issues.
With an increment of sales in mobile phones, the competition within the mobile brands is also increasing. Every person wants a smartphone with the best features within the best rates possible so people are confused because there are numerous brands in the market. Hence, mobile brands face a lot of competition in their field. Now let’s discuss which brands have proved themselves and are in the top 10 list of mobile brands in the world for 2023:
Here are the top 10 mobile phone brands
1. SAMSUNG
Samsung is a big name in phone companies and has emerged as one of the top mobile brands in the world. It is a South Korean company founded on 1st March 1938. It is one of the most trusted brands in the world because of the top-notch facilities provided by the company and its long-lasting smartphones. The smartphones sold by this company are very much user-friendly, the best innovative software, proper customer care facility, cost-effective, etc.
The features and facilities provided by the company have made it the most demanded smartphone brand in the world and its smartphones are the highest sold smartphones in the world. Some of the highest and the best-selling and popular phones of this brand are Samsung Galaxy A51, Samsung Galaxy S20 Ultra, Samsung Galaxy S20, Samsung Galaxy S10e, Samsung Galaxy S10 Plus, Samsung Galaxy Z Flip, Samsung Galaxy Note 10, Samsung Galaxy Note 10 Plus, Samsung Galaxy S9, Samsung Galaxy S9 Plus, Samsung Galaxy Note 8, Samsung Galaxy Fold, Samsung Galaxy Fold 2, Samsung Galaxy M31, Samsung Galaxy M21, Samsung Galaxy Note 10 Lite, Samsung Galaxy A71, Samsung Galaxy A90, and Samsung Galaxy M40.
Sales per year 321.3 million units and revenue per year 211.2 billion USD makes it rank number one in the top mobile brands in the world list.
2. APPLE
It is one of the most premium mobile brands in the world. It is an American multinational technology company and is one of the biggest tech companies in the world. It was founded on April 1st, 1976 by Steve Jobs, Steve Wozniak, Ronald Wayne. The top smartphone hand of this company includes Apple iPhone 11, iPhone 11 Pro, iPhone X, iPhone XS Max, iPhone XR, iPhone 8, iPhone 8 Plus, iPhone SE.
Sales per year 217 plus million phones and revenue per year USD 53.8 billion makes it ranked number two in the list.
3. HUAWEI
It’s one of the wide-ranging smartphone brands in the world. It is a Chinese multinational company founded in 1987 by Ren Zhengfei. Popular handsets launched by this company are Huawei P30 Pro, Huawei Mate 20 Pro, Huawei P30, etc.
Sales per year $107.13 billion, Revenue per year $8397.01 Million makes it rank number three in the list.
4. XIAOMI
It is a Chinese multinational company founded in April 2010 by Lei Jun. With just a few years of its release, it has given a tough competition to its competitors. It’s the world’s 4th most valuable technology startup. Popular smartphones released by this company are Mi 10 Ultra, Redmi Note 9 Pro, Redmi Note 9, Redmi 9, Redmi Note 8, Poco F2 Pro, and Redmi Note 8 pro.
Sales Per year 119 Million, Revenue Per year $25.4 billion makes it rank number four in the list.
5. OPPO
Guangdong OPPO Mobile Telecommunication Corp., Ltd, stylized as OPPO, is a Chinese company founded by Tony Chen in 2001. Some popular handset launched by the company is OPPO A31, OPPO F15, OPPO A5, OPPO F9, OPPO A9, OPPO Reno2, OPPO F3, F5, F7, F11 Pro, F5 Youth, OPPO A83.
Sales Per Year 29 million units, Revenue Per Year $137.7 million makes it fifth in the list.
6. VIVO
VIVO Communication Technology Co. Ltd. Is a Chinese tech company founded in 2009 by Shen Wei. Vivo offers a wide range of phones with great features and specifications. Popular smartphones launched by the company are Vivo V17 Pro, VIVO Z1x, VIVO S1 Pro, VIVO S1, VIVO V17, VIVOZ1 Pro, VIVO S1, VIVO U20, VIVO U10, VIVO V15, VIVO Y11.
Sales Per year 49.5 Million units, Revenue Per Year 46 million USD makes it rank sixth in the list.
7. MOTOROLA
It’s an American multinational telecommunications company in 1928 founded by Paul and Joseph Galvin. After facing a loss of $4.3 billion from 2007 to 2009. The company got divided into two independent public companies, Motorola Mobility and Motorola Solutions in 2011. Popular mobiles launched by this company are Motorola Razr, Mate X, MOTO G8 Plus, MOTO Z4, Motorola One Action, MOTO Z3, MOTO G7 Power, MOTO G7 Plus and Motorola One Vision.
Sales Per Year 12 Million, Revenue Per Year 7.4 billion USD, makes it seventh in the list.
8. LENOVO
LENOVO is a Hong Kong based multinational company founded by Liu Chuanzhi on 1st November 1984. The phones launched by Lenovo are cheap and with the best specification. Smartphones launched by this company is Lenovo Z5, Lenovo K5 Note, Lenovo P2, Lenovo Z2 Plus, Lenovo K6 Power, Lenovo Vibe k5, Lenovo Vibe K5 Note, Lenovo Z5s, Lenovo Z5 Pro GT.
Sales Per Year 35 million units, Revenue Per Year USD 14billion makes it 8th in the list.
9. LG
LG Electronics is a South Korean multinational company founded by Koo-In-hwoi in 1958. The popular smartphones launched by LG are LG G7 Plus ThinkQ, LG W10 Alpha, LG V30 Plus, LG Stylo 5, LG Q70, and LGK61. The smartphones launched by LG didn’t gain a lot of popularity in many countries.
Revue Per Year 54.9 billion USD makes its ninth rank in the list.
10. NOKIA
Nokia is a multinational company founded by Fredrik Idestam, Leo Mechelin, Eduard Finland on 12 May 1865. Before Nokia used to rule the mobile market but as the technology evolved and smartphones were introduced the company couldn’t perform better and by now they are selling smartphones and trying to get better day by day. Popular smartphones launched by Nokia are Nokia 2.3, Nokia 220, Nokia110, Nokia6.2, Nokia 3.2, Nokia9 Pureview, Nokia 8.1, etc.
It is the 10th ranked smartphone brand in the list with its annual sales of more than 17.5 million smartphones.
So, to sum up, these were our views on mobile phones currently available around us. Each company tries to come up with the best features of their mobile phones, some succeed in leaving a great impact on its users. The necessity of mobile phones has increased to a great extent in this current pandemic situation of COVID-19 since almost all students are forced to switch to an online mode of education, and for the same reason, the mobile phone companies are facing tough competition to prove their worth.
Top Stocks to Invest for Long Term in Indian Share Market- 2024
The stock market is a great way to build wealth over time. However, it’s important to have a long-term perspective and understand the benefits of investing stocks for the long haul. Investing in the best stocks to buy for long term investment allows investors to ride out short-term market fluctuations and take advantage of compounding returns. In this article, we’ll discuss long-term stocks to invest in, how to pick them, and a list of best shares to buy for the long term.
Strategies to Select the Best Stock for Long Term Investment
To Wrap It Up…
FAQs
What are Long Term Investment Stocks?
Long term investment stocks mean investing in companies that have strong fundamentals and growth potential, and are held for a period of several years. These long term investment stocks are different from short-term stocks because the latter are typically bought and sold quickly, with the goal of making a profit in a short amount of time. Thus, the long term investing strategy involves buying and holding long term investment stocks that are focused on the company’s long-term growth prospects and fundamentals.
Top 10 Long Term Stocks to Buy in 2024
When it comes to building a solid foundation for your investment portfolio, focusing on long term investment stocks for 2024 or good stocks is the key. Therefore, based on these criteria, below are some of the stocks for long term investment.
Stock Name
Sub-sector
Market Cap (in Cr)
Share Price
5Y Avg Return on Equity (%)
5Y Historical Revenue Growth
5Y CAGR
Bajaj Finance Ltd
Consumer Finance
₹4,48,641.51
₹6,598.15
19.28
26.55
23.55
Titan Company Ltd
Textiles, Apparel & Luxury Goods
₹3,28,263
₹3,559.15
23.76
20.33
31.72
Varun Beverages Ltd
Beverages
₹1,66,364
₹1,347.15
18.42
26.88
59.96
Cholamandalam Investment and Finance Company Ltd
Financials
₹99,434
₹1,157.05
18.68
18.71
40.01
Tube Investments of India Ltd
Consumer Discretionary
₹75,379
₹3,598.25
18.53
24.82
62.35
SRF Ltd
Materials
₹68,921
₹2,283.75
21.38
21.24
41.00
Solar Industries India Ltd
Materials
₹58,432
₹6,731.25
23.04
29.25
46.45
Persistent Systems Ltd
Information Technology
₹63,398
₹8,642
19.01
21.71
70.20
Tata Elxsi Ltd
Information Technology
₹47,362
₹7,721.8
33.61
17.62
53.88
PI Industries Ltd
Materials
₹51,157
₹3,314.45
17.97
23.29
31.82
Note: The data is from 19th January, 2024. However, for real-time updates on stock prices and market trends, visit the stocks collection today!
How to Pick Investment Stocks For Long Term?
When selecting the best share to buy for long term, it’s important to consider a variety of factors. Here are a few key considerations:
Company financials: Look for companies with strong financials, including a healthy balance sheet, positive cash flow, and solid earnings growth.
Management team: A strong management team with a track record of success can help ensure the company is well-run and you can consider it as one of the long term investment stocks.
Competitive advantage: Consider companies with a competitive advantage, such as a strong brand, unique product, or proprietary technology.
Market trends: Search for companies that possess a strong position to capitalize on market trends, such as the transition towards renewable energy or the expansion of e-commerce.
Diversification is an important part of any investment strategy, especially when buying the best shares for long term. Diversification involves spreading your long term investment stocks across a variety of asset classes and sectors to help minimize risk. By diversifying your investments, you reduce your exposure to any single company’s risks and market volatility. At the same time, investors must have a clear idea about their risk appetite and market conditions to achieve their market goals.
Best Long Term Investment Shares-An Overview
Let’s have a look at the long term investment stocks companies that you might be interested to invest in.
Bajaj Finance Ltd
Bajaj Finance Limited (BFL) stands as a prominent non-banking financial company (NBFC) with 73 million customers and assets under management totaling ₹270,050 crore (US$34 billion). According to the Reserve Bank of India’s 2023 list of NBFCs, Bajaj Finance Limited secures the second position in the upper layer, following scale-based regulation guidelines.
Titan Company Ltd
Titan Company Limited, an Indian luxury fashion accessories manufacturer, specializes in jewelry, watches, and eyewear. Established in 1984 as Titan Watches Limited, it expanded its portfolio to include jewelry through Tanishq in 1994 and eyewear through Titan Eyeplus. Fastrack, the youth fashion accessories brand, was introduced in 2005. Part of the Tata Group, Titan is headquartered in Electronic City, Bangalore, and has a registered office in Hosur, Tamil Nadu.
Varun Beverages Ltd
Varun Beverages Ltd, a key player in the RJ Corp group, a diversified conglomerate involved in beverages, quick-service restaurants, dairy, and healthcare, holds the position of the world’s second-largest franchisee (excluding the US) for carbonated soft drinks (‘CSDs’) and non-carbonated beverages (‘NCBs’) under PepsiCo trademarks.
The company operates in 27 Indian States, 7 Union Territories, and 5 international countries, namely Nepal, Sri Lanka, Morocco, Zambia, and Zimbabwe. With a global presence, Varun Beverages runs 37 manufacturing facilities, 31 in India and 6 internationally, utilizing a fleet of over 2500 owned vehicles.
Cholamandalam Investment & Finance Company Ltd
Cholamandalam Investment and Finance Company (CIFCL) is a leading financial services provider in India, offering a wide range of services such as vehicle finance, home loans, SME loans, consumer and small enterprise loans, loan against property, insurance agency, home equity loans, secured business and personal loans, wealth management, stock broking, mutual fund distribution, and various other financial services. With a presence in 1191 branches across the country, CIFCL manages assets totaling over Rs 112,782 Crore.
Tube Investments of India Ltd
Tube Investments of India Limited, initially known as TI Financial Holdings Limited, was established on October 6, 2008, as a wholly-owned subsidiary of the former Tube Investments of India Limited (Demerged Company) under the Companies Act 1956. Through the NCLT-approved Scheme of Arrangement, the Manufacturing Business Undertaking of the Demerged Company became part of the Company on August 1, 2017, with the appointed date being April 1, 2016. Consequently, the Company’s name was changed to Tube Investments of India Limited.
SRF Ltd
SRF Limited, a dynamic chemical multi-business entity, excels in producing industrial and specialty intermediates, claiming market leadership in numerous sectors both in India and globally. Operating in India, Thailand, South Africa, and Hungary, the company spans over 90 countries, categorizing its ventures into Technical Textiles Business (TTB), Chemicals Business (CB), Packaging Films Business (PFB), and Other Businesses.
Solar Industries India Ltd
Solar Industries India Limited produces a wide array of industrial explosives and initiating devices. This includes packaged emulsion explosives, bulk explosives, and explosive initiating systems. The company has diversified into manufacturing military ammunition and boasts the world’s largest packaged explosives facility in Nagpur, India. With 34 manufacturing facilities across India and a global presence in over 65 countries, including manufacturing in 5 countries, Solar Industries is a significant player in the explosives industry.
Persistent Systems Ltd
Persistent Systems Limited, a reliable Digital Engineering Enterprise Modernization partner, collaborates with software product companies and enterprises. With profound technical expertise and industry experience, the company provides unique competitive advantages through its offerings and proven solutions. Working closely with organizations involved in software product development and deployment, Persistent Systems supports them throughout the entire product lifecycle. The team is equipped with proprietary techniques, time-to-market accelerators, connectors, and integration services, facilitating efficient product delivery to end users.
Tata Elxsi Ltd
Tata Elxsi Limited, a subsidiary of the Tata Group, operates globally as a design and technology services company, specializing in product engineering and solution services. The company serves diverse industries such as Automotive, Broadcast Communications, Healthcare, and Transportation. Its operations are divided into Software Development and Services, as well as Systems Integration and Support. Additionally, Tata Elxsi offers product design and engineering services to consumer electronics, communications, and transportation sectors. Moreover, it provides digital content creation for the media and entertainment industry.
PI Industries Ltd
PI Industries Limited (PI) is a leading agri-sciences company, deeply rooted in both domestic and international markets. The company operates three manufacturing facilities in Gujarat, featuring 5 multi-purpose plants at Panoli and 3 at Jambusar. These plants boast advanced high-pressure reaction facilities with cutting-edge automation. Complementing this, the company has two formulation units at Panoli to efficiently cater to the needs of its diverse clientele, both locally and globally. Furthermore, PI’s Research & Development center in Udaipur plays a pivotal role in innovation and advancement within the industry.
How to Invest in the Best Long Term Stocks India?
There are several ways to invest in stocks to invest for long term, including buying individual stocks, mutual funds, and exchange-traded funds (ETFs). Buying individual stocks allows investors to handpick their holdings, but carries a higher level of risk. Mutual funds and ETFs provide diversification and lower risk, but may not offer the same potential for high returns. Investors should choose the best long term stocks to buy that best align with their investment goals and risk tolerance.
Do you have significant financial goals and dreams for your future? Well, investing in the stock market can help you achieve them. But let’s be honest: it is not a walk in the park. The market can be unpredictable and volatile, especially for short-term investments.
But how do you know which are good long-term stocks to buy? How can you spot stocks that stand resilient against market twists? Don’t worry— we have got your back!
We have compiled a list of the 10 best shares to buy today for long-term growth. Whether you are a pro-investor or just starting, our guide will help you make sound investment decisions. So, let’s dive in!
10 Best Long-Term Stocks to Buy in 2024
Choosing the right stocks is crucial. After all, it can be the difference between making a profit and hitting it big! Here are the 10 best shares to buy today for long-term:
Company Stock
Market Cap (crore)
Dividend Yield (%)
Sales Growth (CAGR)
Profit Growth (CAGR)
HDFC Bank
₹11,69,000
1.23
18.7%
19.9%
Hindustan Unilever
₹6,04,408
1.5
9.8%
12.4%
Infosys
₹6,79,000
2.16
10.5%
8.9%
Reliance Industries
₹18,40,000
0.3
12.3%
10.2%
TCS
₹13,97,000
1.32
8.7%
9.5%
IndusInd Bank
₹1,29,000
0.85
21.2%
23.7%
Deepak Nitrite
₹31,805
0.3
24.9%
55.6%
Eicher Motors
₹1,03,851
0.98
8.1%
9.6%
ICICI Bank
₹6,87,000
0.8
15.9%
13.5%
Asian Paints
₹3,11,000
0.8
9.1%
14.2%
1. HDFC Bank
Market cap: ₹11,69,000 crore
Dividend yield: 1.23%
Sales Growth: 18.7% (CAGR)
Profit Growth: 19.9% (CAGR)
With a strong foothold in the retail banking sector, HDFC has a proven track record of delivering exceptional financial performance and high profitability.
The company has a diversified loan portfolio, a low non-performing asset ratio, and a robust brand value. So, if you are looking for a stable and growing dividend income and capital appreciation, HDFC Bank is a solid choice.
2. Hindustan Unilever
Market cap: ₹6,04,408 crore
Dividend yield: 1.5%
Sales growth: 9.8% (CAGR)
Profit growth: 12.4% (CAGR)
Are you seeking a resilient stock offering steady growth and dividends? Look no further than Hindustan Unilever! This company boasts strong corporate governance, a high return on capital employed, and a consistent dividend payout policy.
With a strong brand portfolio, a loyal consumer base, and a robust innovation pipeline, Unilever is a good bet.
3. Infosys
Market cap: ₹6,79,000 crore
Dividend yield: 2.16%
Sales growth: 10.5% (CAGR)
Profit growth: 8.9% (CAGR)
If you want to invest in a company with a global footprint and a focus on innovation and research, then Infosys is the way to go! Infosys also has a healthy balance sheet, high cash flow generation, and a generous dividend payout policy.
Plus, the company is well-positioned to benefit from the increasing demand for IT services and digital solutions.
4. Reliance Industries
Market cap: ₹18,40,000 crore
Dividend yield: 0.3%
Sales growth: 12.3% (CAGR)
Profit growth: 10.2% (CAGR)
Reliance is India’s largest conglomerate with diverse oil and gas, telecom, retail, digital, and media avenues. Its strong financial position and consistent dividends make it perfect for long-term investors.
So, if you want to benefit from diversification and digitalisation trends, choose this best long-term stock.
5. TCS
Market cap: ₹13,97,000 crore
Dividend yield: 1.32%
Sales growth: 8.7% (CAGR)
Profit growth: 9.5% (CAGR)
As India’s largest and most profitable IT services company, TCS boasts a global presence and a diversified service portfolio. With a loyal client base and a strong balance sheet, it is the best share to buy for the long term.
Plus, with its generous dividend payout policy, you can rest assured that your investment is in good hands.
6. IndusInd Bank
Market cap: ₹1,29,000 crore
Dividend yield: 0.85%
Sales growth: 21.2% (CAGR)
Profit growth: 23.7% (CAGR)
Looking for a rapidly expanding private-sector bank in India? IndusInd Bank is a name you can trust. With a sound financial position and consistent dividend payments, they cater to underbanked population segments. A value-oriented and growth-focused stock worth considering!
7. Deepak Nitrite
Market cap: ₹31,805 crore
Dividend yield: 0.3%
Sales growth: 24.9% (CAGR)
Profit growth: 55.6% (CAGR)
The company offers a killer combination of high revenue, low debt, and impressive free cash flow. It is one of the good stocks to buy for the long term.
So, if you are a long-term investor looking for value and diversification-oriented shares, Deepak Nitrite can boost your wealth creation.
8. Eicher Motors
Market cap: ₹1,03,851 crore
Dividend yield: 0.98%
Sales growth: 8.1% (CAGR)
Profit growth: 9.6% (CAGR)
Eicher Motors is the flagship company of the Eicher Group, with an incredible track record of delivering solid revenue and profit growth. It focuses on brand building, product innovation, network expansion, and customer loyalty!
Moreover, the company has a high operating margin, return on equity, and free cash flow – making it one of the best stocks to buy for the long term.
9. ICICI Bank
Market cap: ₹6,87,000 crore
Dividend yield: 0.8%
Sales growth: 15.9% (CAGR)
Profit growth: 13.5% (CAGR)
ICICI shares are good stocks to buy for long-term investors who want to benefit from the growth potential of the Indian banking sector.
As India’s most prominent paint company, Asian Paints has a dominant market share and an extensive distribution network. It could be an excellent choice if you want to put your money in a defensive stock with tremendous value!
Factors to Consider
Now you know the 10 best shares to buy today for the long term, but how do you assess which are right for you? Here are some crucial factors to remember:
Look at the company’s financial health, profitability, and competitive positioning.
You will also want to analyse industry growth prospects, considering market dynamics, competition, and technological shifts.
Reckon the leadership and management team’s track record and vision for the future.
Consider macroeconomic factors like interest rates and inflation that may impact a stock’s performance.
Summing Up
Investing in the stock market can be a lucrative approach that pays off in the long run. You can make informed decisions by selecting top-performing companies and considering key metrics.
Remember to research well and make smart decisions, and you’ll be able to maximise benefits from your investments.
FAQs
2. Are these shares suitable for conservative investors?
No, not all shares are created equal! Some are perfect for traditional investors due to their stability and consistent performance. Speak to a financial advisor to align your investments with your goals and risk tolerance.
2. How should I allocate funds among these 10 best long-term stocks?
The best strategy is to diversify your investment across multiple sectors and companies. Consider your risk appetite, investment goals, and stock performance before parking your funds.
3. How often should I review my long-term investment portfolio?
You must check your portfolio quarterly or semi-annually. It allows you to assess the performance of your assets and make any necessary adjustments.